Digitization help student to explore and study their academic courses online, as this gives them flexibility and scheduling their learning at their convenience. Kidsfront has prepared unique course material of Numerical Ability Data Interpretation for UIIC ASSISTANT RECRUITMENT student. This free online Numerical Ability study material for UIIC ASSISTANT RECRUITMENT will help students in learning and doing practice on Data Interpretation topic of UIIC ASSISTANT RECRUITMENT Numerical Ability. The study material on Data Interpretation, help UIIC ASSISTANT RECRUITMENT Numerical Ability students to learn every aspect of Data Interpretation and prepare themselves for exams by doing online test exercise for Data Interpretation, as their study progresses in class. Kidsfront provide unique pattern of learning Numerical Ability with free online comprehensive study material and loads of UIIC ASSISTANT RECRUITMENT Numerical Ability Data Interpretation exercise prepared by the highly professionals team. Students can understand Data Interpretation concept easily and consolidate their learning by doing practice test on Data Interpretation regularly till they excel in Numerical Ability Data Interpretation.
 Number of students whose IQ score is 140 is
.png)
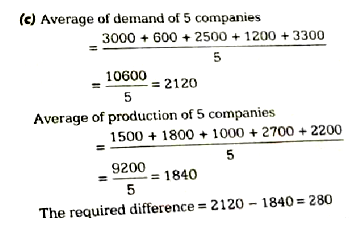
 Correct Answer Is : Undeterminable from given data Number of students whose IQ score is 140 is Correct Answer Is : 35 Study the folllowing table showing marks obtained by 6 candidates ( A , B , C , D , E and F ) in 6 tests conducted in one academic year and answer the question given below .
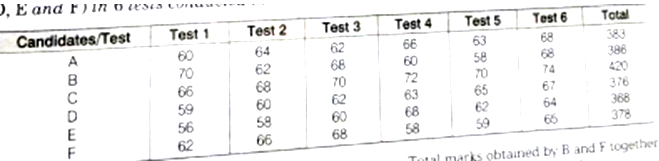 Correct Answer Is : 5 Study the folllowing table showing marks obtained by 6 candidates ( A , B , C , D , E and F ) in 6 tests conducted in one academic year and answer the question given below .
 Correct Answer Is : D Study the folllowing table showing marks obtained by 6 candidates ( A , B , C , D , E and F ) in 6 tests conducted in one academic year and answer the question given below .
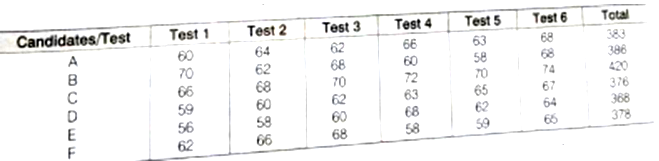 Correct Answer Is : E Study the folllowing table showing marks obtained by 6 candidates ( A , B , C , D , E and F ) in 6 tests conducted in one academic year and answer the question given below .
 Correct Answer Is : Test 6 A person can row 7 1/2 km/h in still water and he finds that it takes him twice as long to row up as to row down the river. The speed of the strem is Correct Answer Is : 2 1/2 km/h
  The following tables shows the prodection of food grains (in millian tonnes) in a State for the period 1988 10 1992. Read the table and answer the qustions. Correct Answer Is : 0.0256 The following tables shows the prodection of food grains (in millian tonnes) in a State for the period 1988 10 1992. Read the table and answer the qustions. Correct Answer Is : Maize
 The following tables shows the prodection of food grains (in millian tonnes) in a State for the period 1988 10 1992. Read the table and answer the qustions. Correct Answer Is : 1989