Digitization help student to explore and study their academic courses online, as this gives them flexibility and scheduling their learning at their convenience. Kidsfront has prepared unique course material of General Intelligence & Reasoning Venn Diagram for SSC CGL Exam student. This free online General Intelligence & Reasoning study material for SSC CGL Exam will help students in learning and doing practice on Venn Diagram topic of SSC CGL Exam General Intelligence & Reasoning. The study material on Venn Diagram, help SSC CGL Exam General Intelligence & Reasoning students to learn every aspect of Venn Diagram and prepare themselves for exams by doing online test exercise for Venn Diagram, as their study progresses in class. Kidsfront provide unique pattern of learning General Intelligence & Reasoning with free online comprehensive study material and loads of SSC CGL Exam General Intelligence & Reasoning Venn Diagram exercise prepared by the highly professionals team. Students can understand Venn Diagram concept easily and consolidate their learning by doing practice test on Venn Diagram regularly till they excel in General Intelligence & Reasoning Venn Diagram.
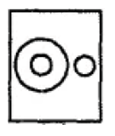
 Identify the diagram that best represents the relationship among classes given below.


 Correct Answer Is :
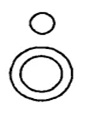
 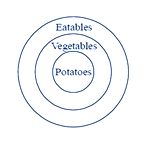 Identify the diagram that best represents the relationship among classes given below.
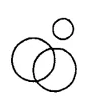


 Correct Answer Is :
 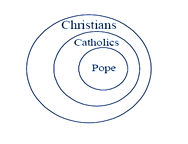 In each of the following questions, identify the diagram that
best represents the relationship among classes given below :
In each of the following questions, identify the diagram that
best represents the relationship among classes given below :
 Correct Answer Is :
 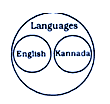 In each of the following questions, identify the diagram that
best represents the relationship among classes given below :
In each of the following questions, identify the diagram that
best represents the relationship among classes given below :


 Correct Answer Is :
 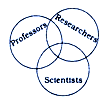 In each of the following questions, identify the diagram that
best represents the relationship among classes given below :
In each of the following questions, identify the diagram that
best represents the relationship among classes given below :


 Correct Answer Is : In the given figure 10% are students and parents, and the 10% are students, teachers and parents, 15% are teachers and parents. 35% are students and teachers. How many percentage are only teachers, parents and students.
 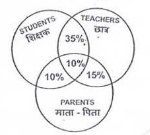 Correct Answer Is : 40,65,45 Identify the diagram that best represents the relationship among the classes given below:
 Correct Answer Is : Which one of the following diagrams best depicts the relationship among


 Correct Answer Is : In the given diagram, circle represents professionals, square represents dancers, triangle represents musicians and rectangle represents Europeans. Different regions in the diagram are numbered 1 to 11. Who among the following is neither a
dancer nor a musician but is professional and not a European ?
Correct Answer Is : In the given diagram, circle represents professionals, square represents dancers, triangle represents musicians and rectangle represents Europeans. Different regions in the diagram are numbered 1 to 11. Who among the following is neither a
dancer nor a musician but is professional and not a European ? 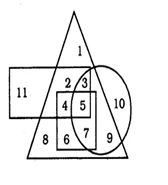 Correct Answer Is : 10 Which one of the following diagrams represents the correct relationship among `Judge`, Thief and `Criminal` ?
 Correct Answer Is :