Digitization help student to explore and study their academic courses online, as this gives them flexibility and scheduling their learning at their convenience. Kidsfront has prepared unique course material of Data Interpretation Data Interpretation for Quantitative Aptitude Practice student. This free online Data Interpretation study material for Quantitative Aptitude Practice will help students in learning and doing practice on Data Interpretation topic of Quantitative Aptitude Practice Data Interpretation. The study material on Data Interpretation, help Quantitative Aptitude Practice Data Interpretation students to learn every aspect of Data Interpretation and prepare themselves for exams by doing online test exercise for Data Interpretation, as their study progresses in class. Kidsfront provide unique pattern of learning Data Interpretation with free online comprehensive study material and loads of Quantitative Aptitude Practice Data Interpretation Data Interpretation exercise prepared by the highly professionals team. Students can understand Data Interpretation concept easily and consolidate their learning by doing practice test on Data Interpretation regularly till they excel in Data Interpretation Data Interpretation.
 Study the following pie-chart and the table and answer the questions based on them.
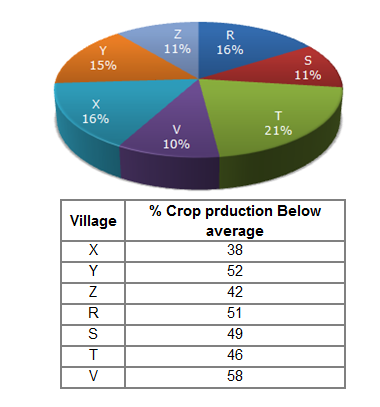
 Correct Answer Is : 15600 Study the following pie-chart and the table and answer the questions based on them. Correct Answer Is : 23:11 Study the following pie-chart and the table and answer the questions based on them. Correct Answer Is : 22000 Study the following pie-chart and the table and answer the questions based on them. Correct Answer Is : 12760 The following line graph gives the percentage of the number of candidates who passed their board examination out of the total number of candidates who appeared for the examination over a period of seven years from 1994 to 2000.
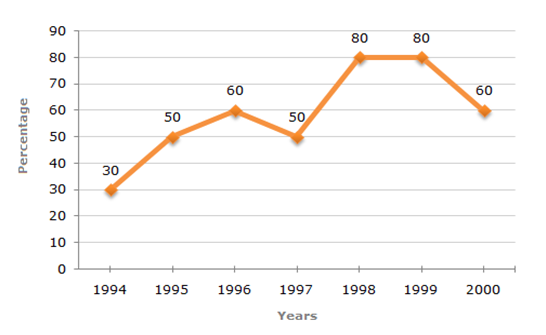 Correct Answer Is : 1997 and 1998 The following line graph gives the percentage of the number of candidates who passed their board examination out of the total number of candidates who appeared for the examination over a period of seven years from 1994 to 2000. Correct Answer Is : Data inadequate The following line graph gives the percentage of the number of candidates who passed their board examination out of the total number of candidates who appeared for the examination over a period of seven years from 1994 to 2000. Correct Answer Is : 26500 The following line graph gives the percentage of the number of candidates who passed their board examination out of the total number of candidates who appeared for the examination over a period of seven years from 1994 to 2000. Correct Answer Is : Data inadequate The following line graph gives the percentage of the number of candidates who passed their board examination out of the total number of candidates who appeared for the examination over a period of seven years from 1994 to 2000. Correct Answer Is : 20500 Study the following table and answer the questions based on it.
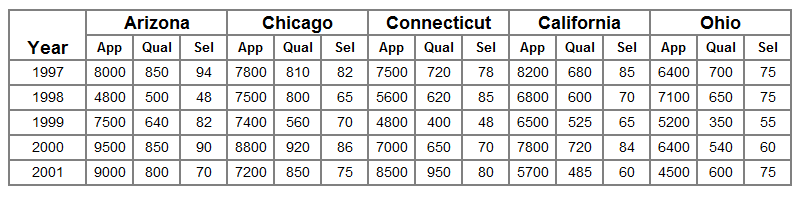 Correct Answer Is : Arizona