Digitization help student to explore and study their academic courses online, as this gives them flexibility and scheduling their learning at their convenience. Kidsfront has prepared unique course material of Mathematics Statistical for NDA Exam student. This free online Mathematics study material for NDA Exam will help students in learning and doing practice on Statistical topic of NDA Exam Mathematics. The study material on Statistical, help NDA Exam Mathematics students to learn every aspect of Statistical and prepare themselves for exams by doing online test exercise for Statistical, as their study progresses in class. Kidsfront provide unique pattern of learning Mathematics with free online comprehensive study material and loads of NDA Exam Mathematics Statistical exercise prepared by the highly professionals team. Students can understand Statistical concept easily and consolidate their learning by doing practice test on Statistical regularly till they excel in Mathematics Statistical.
 The average marks secured by 36 students was 52. but it was discovered that an item 64 was misred as 64.what is the correct mean of mark?
 Correct Answer Is : 52.5 The mean high temperature of the first four days of a week is 25°C whereas the mean of the last four days is 25.5°C.
If the mean of the whole week is 25.2°C, then the temperature of the 4th day is Correct Answer Is : 25.6°C
Correct Answer Is : 52.5 The mean high temperature of the first four days of a week is 25°C whereas the mean of the last four days is 25.5°C.
If the mean of the whole week is 25.2°C, then the temperature of the 4th day is Correct Answer Is : 25.6°C Facts or information collected with a definite purpose is called
Correct Answer Is : Data When the information is gathered from a source which already has the information stored, then the data is called Correct Answer Is : Secondary data Class mark equals to Correct Answer Is : Lower limit+upper limit/2 The lower limit of 45-51 is Correct Answer Is : 45 In the following frequency distribution, the number of students of age less than 25 years is 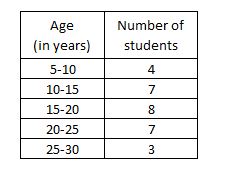 Correct Answer Is : 26 If the range of distribution is 60 and the class interval is 10, then the number of classes is Correct Answer Is : 6 Range of the following data is 54,36,96,42,38,64,72,36,68,46 Correct Answer Is : 60 In the distribution, the frequency of the class 3-5 is 4,8,3,6,7,2,3,5,9,4,6,5,5 Correct Answer Is : 4