An Educational platform for Preparation and Practice Class 6. Kidsfront provide unique pattern of learning Maths with free online comprehensive study material in the form of QUESTION & ANSWER for each Chapter of Maths for Class 6. This study material help Class 6, Maths students in learning every aspect of Data Handling. Students can understand Data Handling concept easily and consolidate their learning by doing Online Practice Tests on Maths,Data Handling chapter repeatedly till they excel in Class 6, Data Handling. Free ONLINE PRACTICE TESTS on Class 6, Data Handling comprise of Hundreds of Questions on Data Handling, prepared by the highly professionals team. Every repeat test of Data Handling will have new set of questions and help students to prepare themselves for exams by doing unlimited Online Test exercise on Data Handling. Attempt ONLINE TEST on Class 6,Maths,Data Handling in Academics section after completing this Data Handling Question Answer Exercise.
Unique pattern
 The following pictograph shows the colours of fridge preferred by the customer living in a locality. Which colour preferred least?
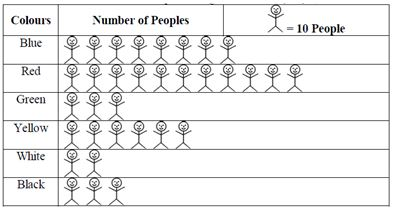
 Correct Answer Is : White The following pictograph shows the colours of fridges preferred by people living in a locality. Which two colours liked by the same number of people? Correct Answer Is : Green and black The following pictograph shows the colours of fridges preferred by people living in a locality. Find the number of people preferring yellow colour. Correct Answer Is : 60 A _____ is a collection of numbers gathered to give some information. Correct Answer Is : Data The tally mark given below shows frequency _____________.
 Correct Answer Is : 10 Go through the bar graph which is showing the sale of shirts in a ready-made shop from Monday to Saturday. On which day were the maximum number of shirts sold?
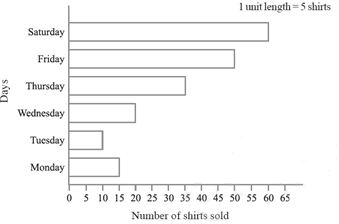 Correct Answer Is : Saturday Go through the bar graph which shows the sale of shirts in shop from Monday to Saturday. On which day were the minimum number of shirts sold? Correct Answer Is : Tuesday Go through the bar graph which is showing the sale of shirts in shop from Monday to Saturday. How many shirts were sold on Thursday? Correct Answer Is : 35 Go through the bar graph which is showing the sale of shirts in shop from Monday to Saturday. How many shirts were sold on Monday? Correct Answer Is : 15 Observe this bar graph which shows the sale of shirts in shop from Monday to Saturday. How many shirts were sold on Wednesday? Correct Answer Is : 20